July 2021 Inventory Trends
July 2021 NPGA Propane Inventory Report (July 8, 2020)
The current global and US crude oil market situation and key messages and implications to the US propane market
OPEC+ could not come together to lower oil prices. Brent and WTI prices are currently above $70 per barrel ($/bbl), the highest level since 2018. Fast-rising global oil demand has been the catalyst of a 40% plus price rise since the beginning of the year. While at the same time, OPEC+ supply has been in restraint and has kept between 8 and 9 million barrels per day (b/d) of capacity off the market so far this year.
OPEC+ leaders typically avoid identifying an explicit price objective. But price levels are the ultimate oil market fundamental and the driver of OPEC+ decisions. More OPEC+ supply will not come to the market simply to lower prices. If more supply comes, it will be to profit from higher prices and protect or gain market share. Saudi Arabia, for example, is keen to follow demand and not get ahead of it. This behavior supports a thesis of higher prices and not lower prices, at least for a time. Despite higher prices this year, the threat of a run up in U.S. activity and U.S. crude oil production is very unlikely. The U.S. producing community, the E&P companies, continue to feel pressure from their stakeholders including Wall Street to operate within cash flow and minimally grow production on a full year 2021 basis. So, the likelihood of a supply surge in U.S. crude oil production for the latter half of this year is very low.
Summarizing this month’s key global crude oil market messages:
- The implicit OPEC+ crude oil price objective is tilted towards higher prices and not lower prices.
- The global crude oil demand spike – up from 7 million b/d from first quarter 2021 to third quarter 2021 – is underway.
- Before the global crude oil price spikes to $100 or even $80/bbl, countries outside of OPEC+ and some within OPEC+, will want to produce as much as they can.
- The failed talks this past week between OPEC+ ministers leaves Saudi Arabia’s desire to manage the market supplies from August onward at risk. Any core OPEC disagreements is unhealthy and sets the stage for an unmanaged increase in supply from a large block of the global supply stack.
- This leads to higher price volatility and further paralyzing the U.S. upstream producers from increasing production rates in 2021.
IHS Markit’s U.S. crude oil production has remained unchanged from last month, but managed global supplies could result in slightly higher production rates in 2022. U.S. crude oil production is expected to increase by around 0.2 to 0.4 million b/d entry to exit for 2021 and 0.4 to 0.8 million b/d entry to exit for 2022. “Entry to exit” means January production rate compared to December production rate for the year. IHS Markit expects U.S. oil production will average around 11.0 MMb/d in 2021, and 11.5 MMb/d in 2022.
The U.S. supply and demand situation fits within the global oil fundamental market framework and the global crude oil balances and pricing are key market indications and drivers for U.S. propane market supplies. Summarizing current crude oil and propane pricing over the last month and price linkages between these prices are as follows:
- Average WTI crude oil price for the month of June was $71/bbl and $6 higher as compared to the last month average, the maximum daily price for the month of June was $73 and minimum daily price was $67/bbl.
- Average Mont Belvieu non-TET propane price for the month of June was 97 cents per gallon (cpg) and up 14 compared to last month, the maximum daily price for the month of June was 108 and a minimum of 90 cpg.
- The Mont Belvieu propane price as percentage of the crude oil price averaged 57% for the month of May, the maximum daily propane price as a percentage of the crude oil price was 62% and the minimum daily was 55%.
The current U.S. propane market has continued to be very tight from a supply and demand perspective supporting higher prices despite approaching the normal seasonal demand trough. Mont Belvieu daily prices for the month of June increased from around 92 to 108 cpg by month end.
The U.S. Propane Market Outlook and Expectations
Higher crude oil prices, the impact of Winter Storm Uri and seasonally lower inventory levels, and relatively strong propane exports continue to support propane prices over $1 per gallon. The U.S. upstream oil and natural gas production situation remains restrained and constrained financially leading to minimal US oil and natural gas production growth over 2021. This, along with U.S. refined product demand still slightly behind last year’s demand, holds total US propane production relatively flat over calendar year 2021 at around 2.5 million b/d, approximately 0.2 million b/d above last year. Total propane production from natural gas processing plants and refineries was approximately 2.4 million b/d in January 2021 and is expected to increase to approximately 2.7 million b/d by December 2021. Total propane production over the balance of the forecast period, January through May 2022, is expected to be relatively stable at around 2.7 million b/d.
The forecast and outlook for U.S. propane fundamentals has changed minimally as compared to last month’s trend report highlighted by slightly lower supplies, slightly lower demand, and minimally lower inventory levels over the next 12-month period. Exports have been reduced as compared to last month’s forecast as higher prices will impact the attractiveness of US exports. Exports are expected to soften during the winter months, mainly January through April of next year, buoyed by the continuation of a tight propane market both from a U.S. and international perspectives as compared to today. Average exports in last month’s trend report was forecasted to average around 1.29 million b/d between May 2021 and April 2022. Given the market tightness and higher prices forecasted over the period exports are now forecasted slightly lower, 1.28 million b/d, and could go slower. Also, average propane production from natural gas production is expected to average almost 1.77 million b/d between May 2021 and April 2022, up approximately 10,000 b/d as compared to last month’s trend report. U.S. propane from natural gas processing is the major supply source and key driver for overall propane supplies.
Current and forecasted U.S. propane inventory levels continue to lag compared to the same period last year. Current total inventory for the end of June 2021 is estimated at approximately 59.6 million barrels, 19.7 million barrels below the same time last year. Monthly propane inventory is expected to rise to a peak of 72.8 million barrels in September, almost 32 million barrels below the same time last year. As production grows slowly over the balance of this year and through the upcoming winter season Mont Belvieu propane prices are expected to remain at very high levels. These high price levels will likely slow, albeit slightly, exports to international destinations thereby allowing inventory to approach last year’s levels by January 2022.
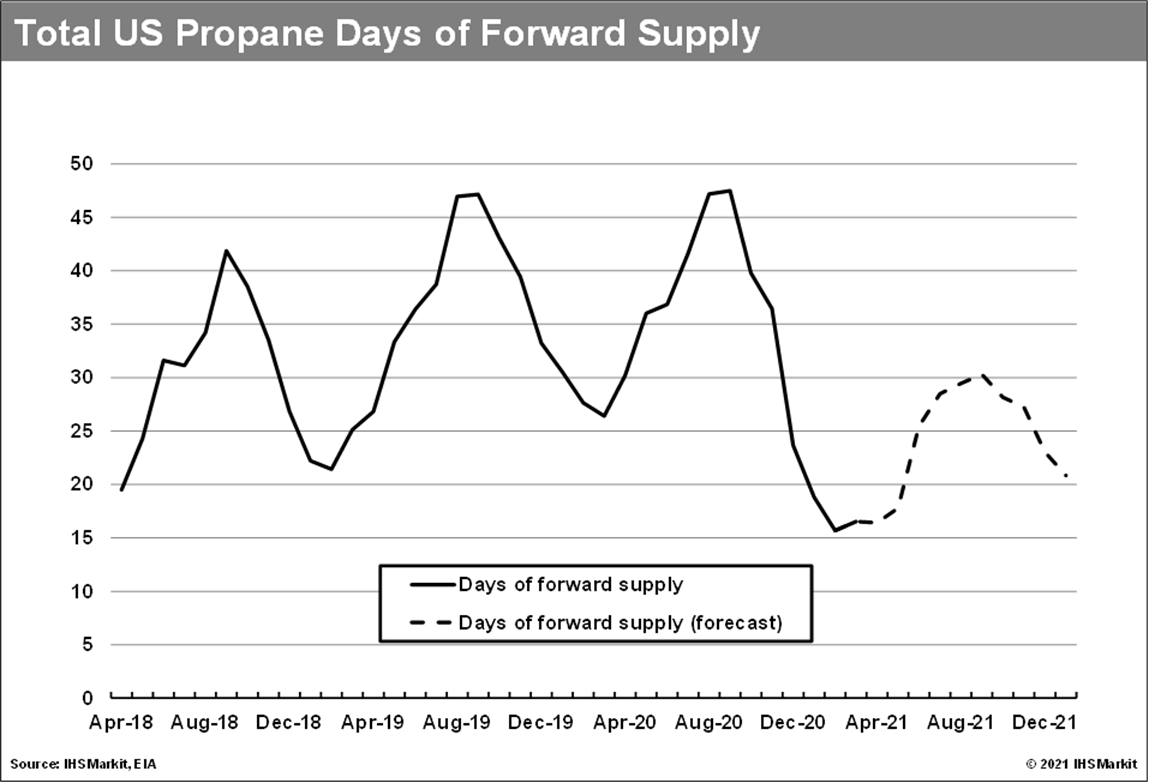
It is important to note, inventory levels over this same period are expected to be below the 5-year average, approximately 13.7 million barrels below the 5-year average for April 2021 through January 2022. Days of forward supply or days of demand were 16.4 days in April 2021 and are forecasted to slowly rise to 30.2 days in September 2021 and then falling back to 20.8 days in January 2022. The days of forward supply for April 2021 through January 2022 are estimated to be an average of almost 10 days below the same period last year. Relief could come in 2022, but that’s a long time from now and winter is coming.
Note 1: IHS Markit has included below a US propane inventory chart and PADD inventory charts (in the Snapshot 07 (July) 2021 workbook and the “Weekly Inventory Charts 16-20” tab) over the inventory cycle comparing the current year, actual and forecast, versus last year. The weekly inventory charts have been updated to reflect the last 5 years data, full year 2016 through 2020. An additional chart has been added and reflects total US inventory expressed in days of forward supply.
July 2021 Summary
July 2021 Snapshot
July 2021 Stock Report
July 2021 Supply/Demand Tracker